We know how important it is to understand what works in your account and what doesn't. Now you have all the tools to not only post on Threads but also to deeply analyze content effectiveness and audience growth.
Let's take a look at what data is now available and how to use it.
To get started, go to the analytics section, select the Threads account, and specify the period for which you want to receive data. It's straightforward, and then the fun begins.
Dashboard
Here you will find key metrics: likes, comments, follower dynamics. Everything you need for a quick assessment of your profile's status. One glance, and you understand whether everything is going according to plan.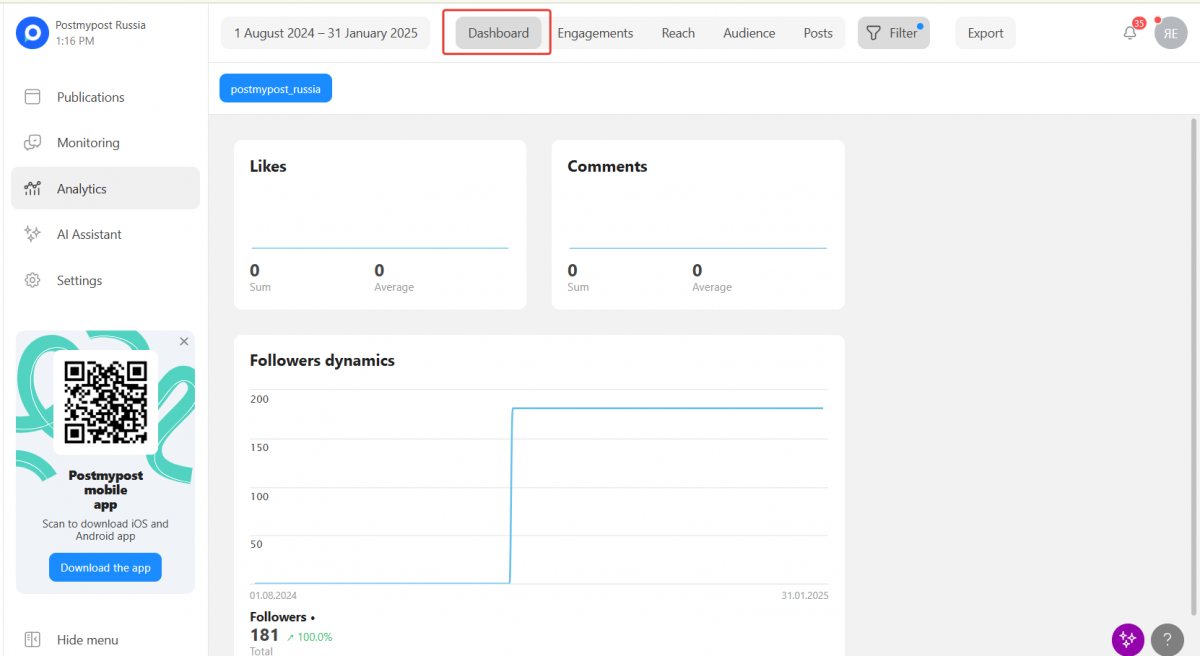
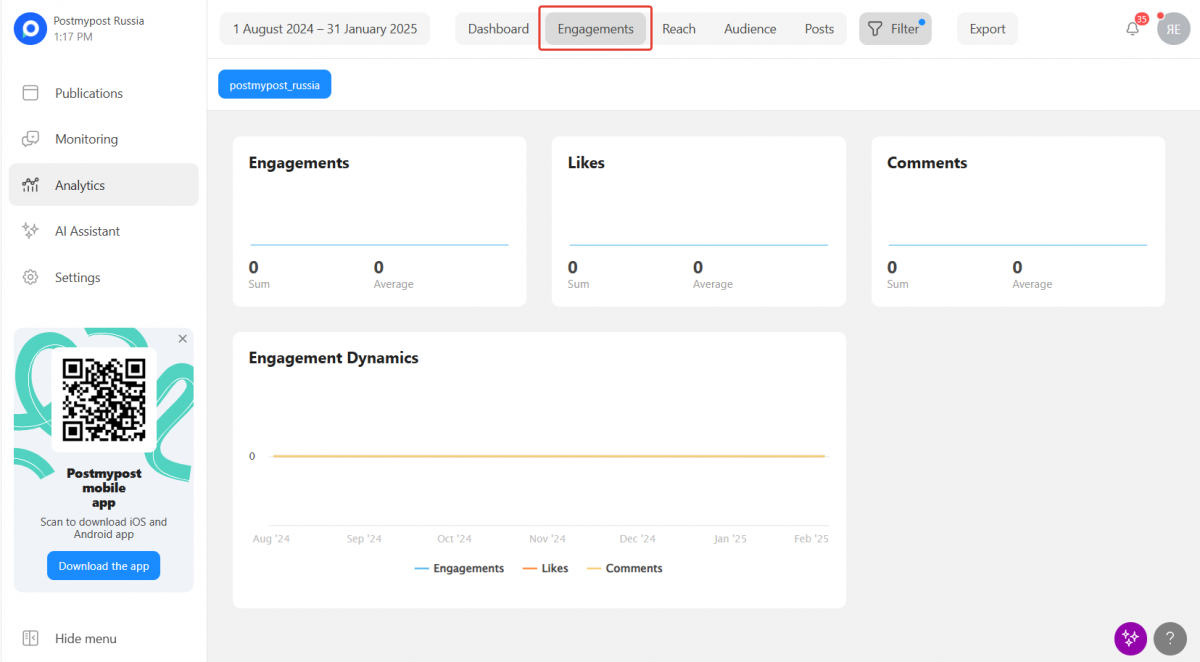
Engagements
In this section, you will find detailed statistics on likes and comments over time. You will see during which periods the audience was most active and when interest declined.
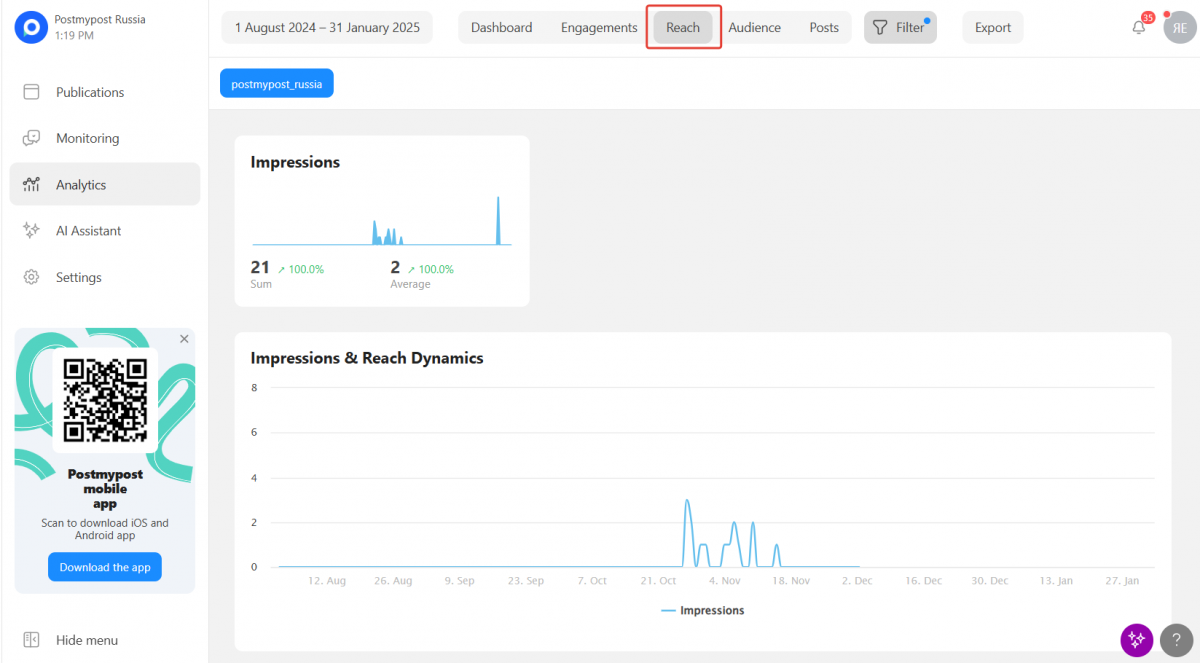
Reach
Reach is the primary indicator of content distribution. In this section, you can track how many users have seen your content and how this number changes over time.
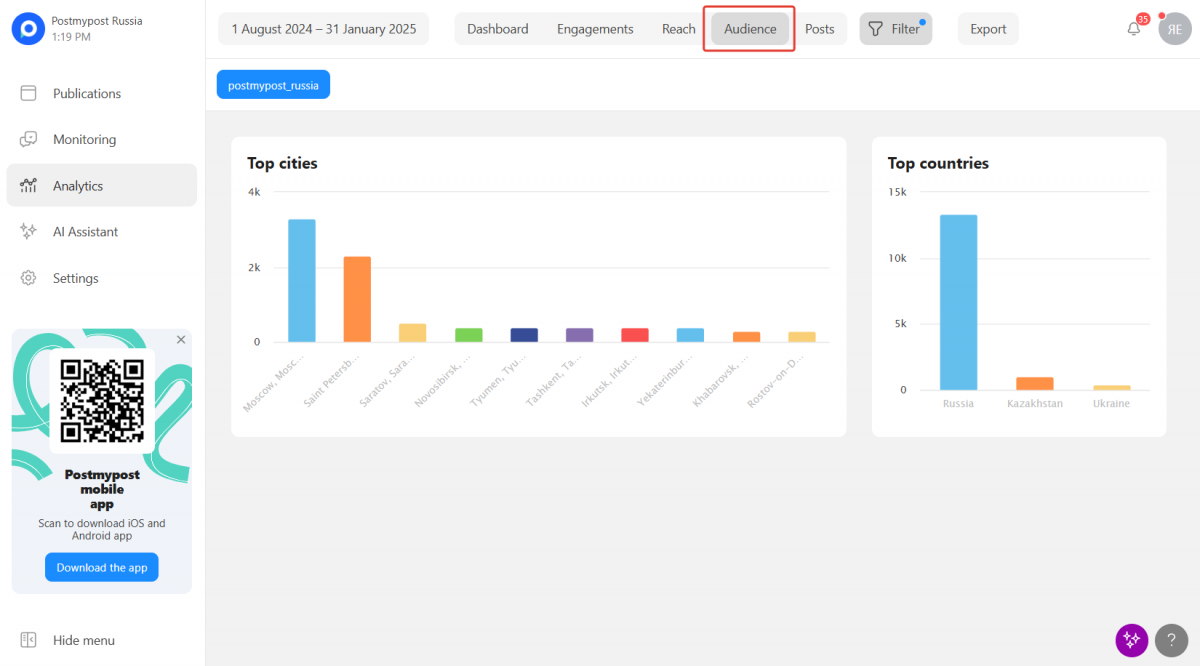
Audience
Geography is important, especially if you are working on local promotion. This section provides data on the location of your audience, which is useful if you want to tailor content for different regions.
And if you need to share results with your team or clients, just export the report as a PDF.
Do you have ideas on how to improve this feature?
Go to the "Share an Idea" section, share your thoughts, vote for updates, and join the discussion.